Introduction
The Insights Tab provides a detailed view of the running pods in a cluster.

Pod Overview
You can gain further understanding of a specific pod by clicking on its name to access the pod’s overview. This view displays information such as the namespace, creation date, number of restarts, labels, and annotations of the pod.

Monitoring Pod Events
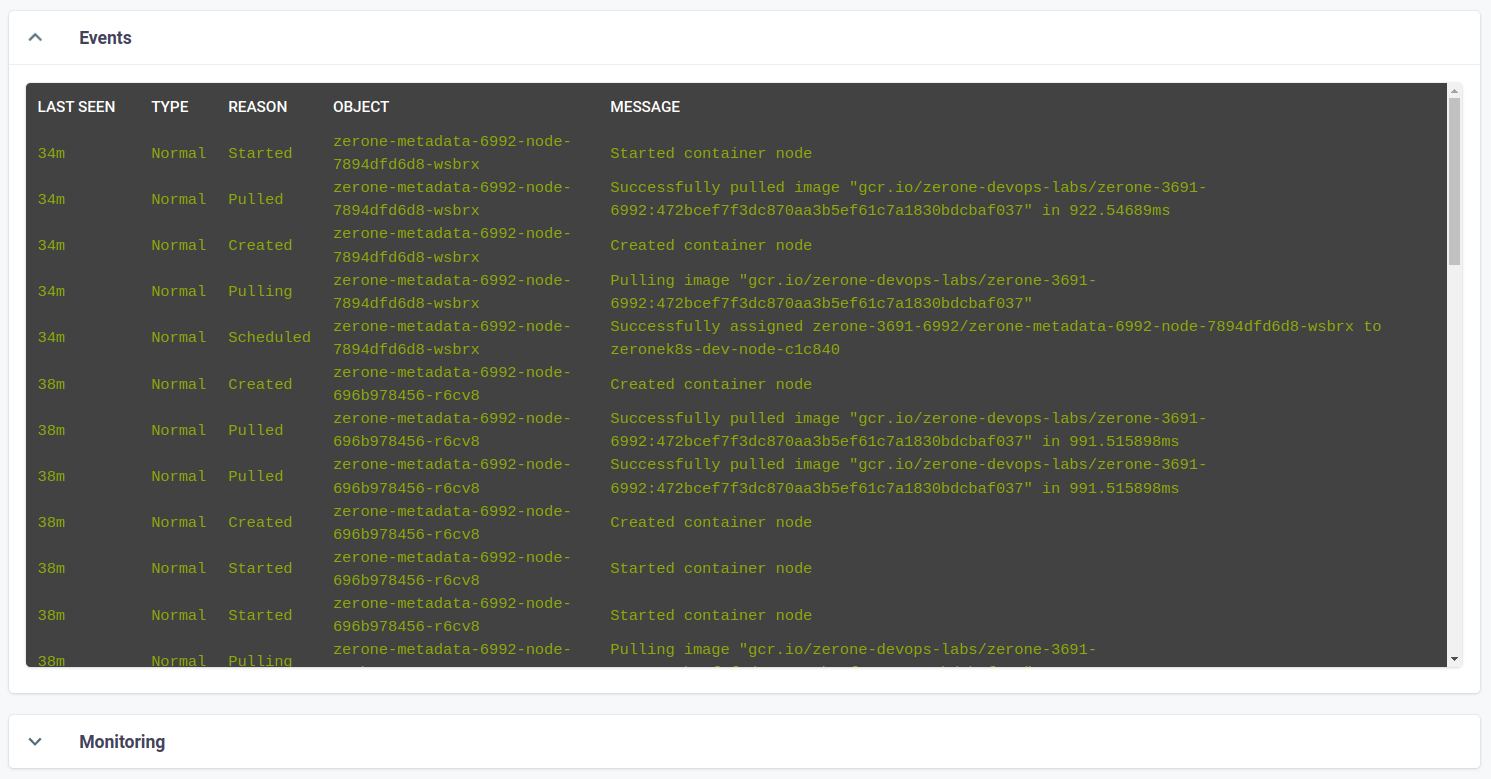
The Insights Tab also allows you to view events related to a selected pod, and monitor those events in real-time.

Container Details
You can obtain details about a container by clicking on it within the Container tab. The container’s overview includes information such as its image, port, start time, number of restarts, CPU request and limit, as well as memory request and limit. There is also a Mounts tab where you can view the path of the PVC.

Viewing Container Logs
The Insights Tab also provides a convenient way to view the logs for a selected container. Simply click the VIEW LOGS button in the top right corner.

Accessing the Container’s WebShell
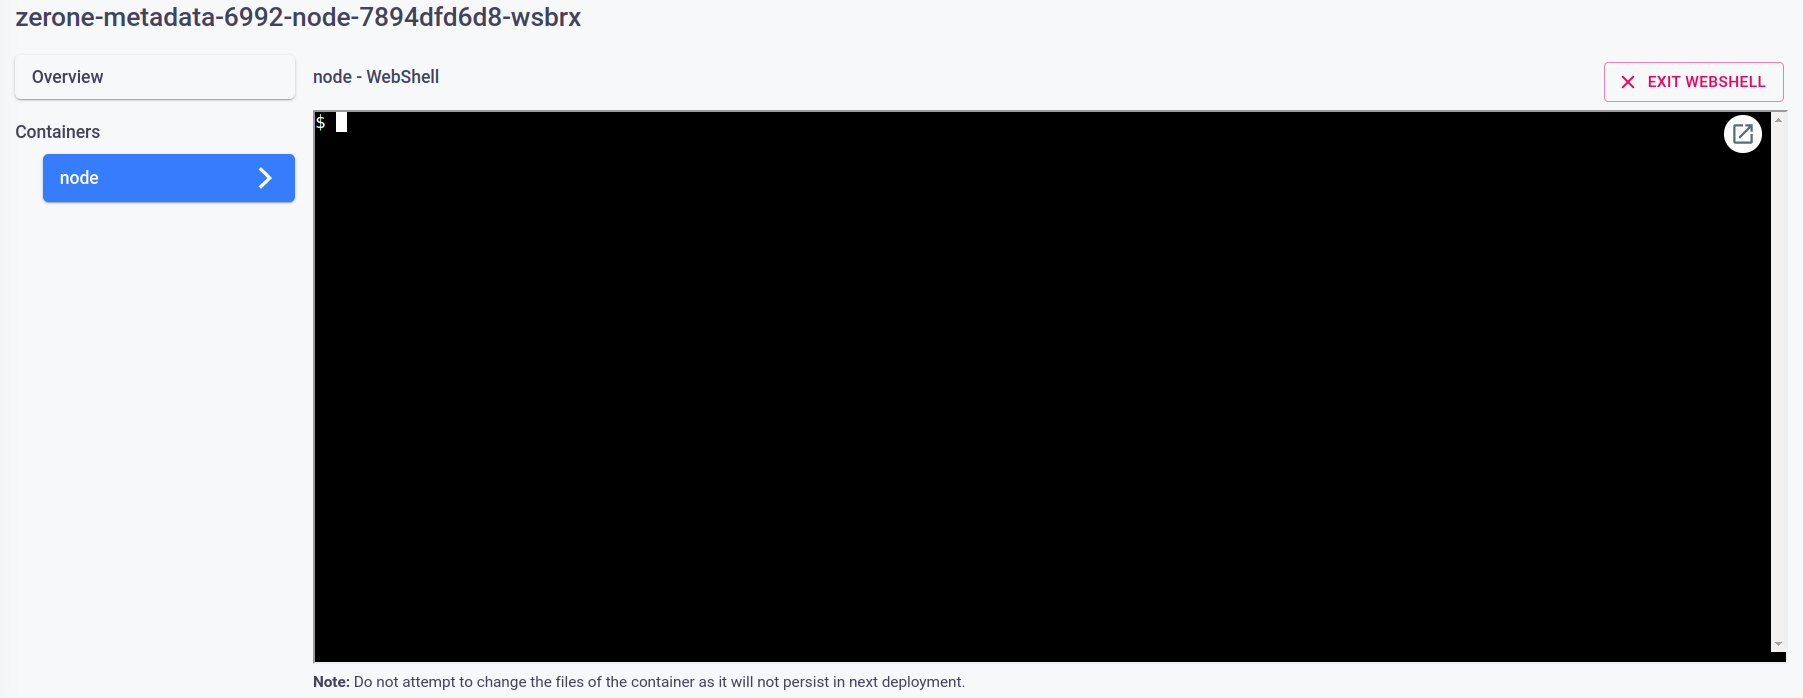
In addition to viewing logs, you can also access the WebShell for a selected container and use it for your own purposes by clicking the WEBSHELL button.

Monitoring Container Performance
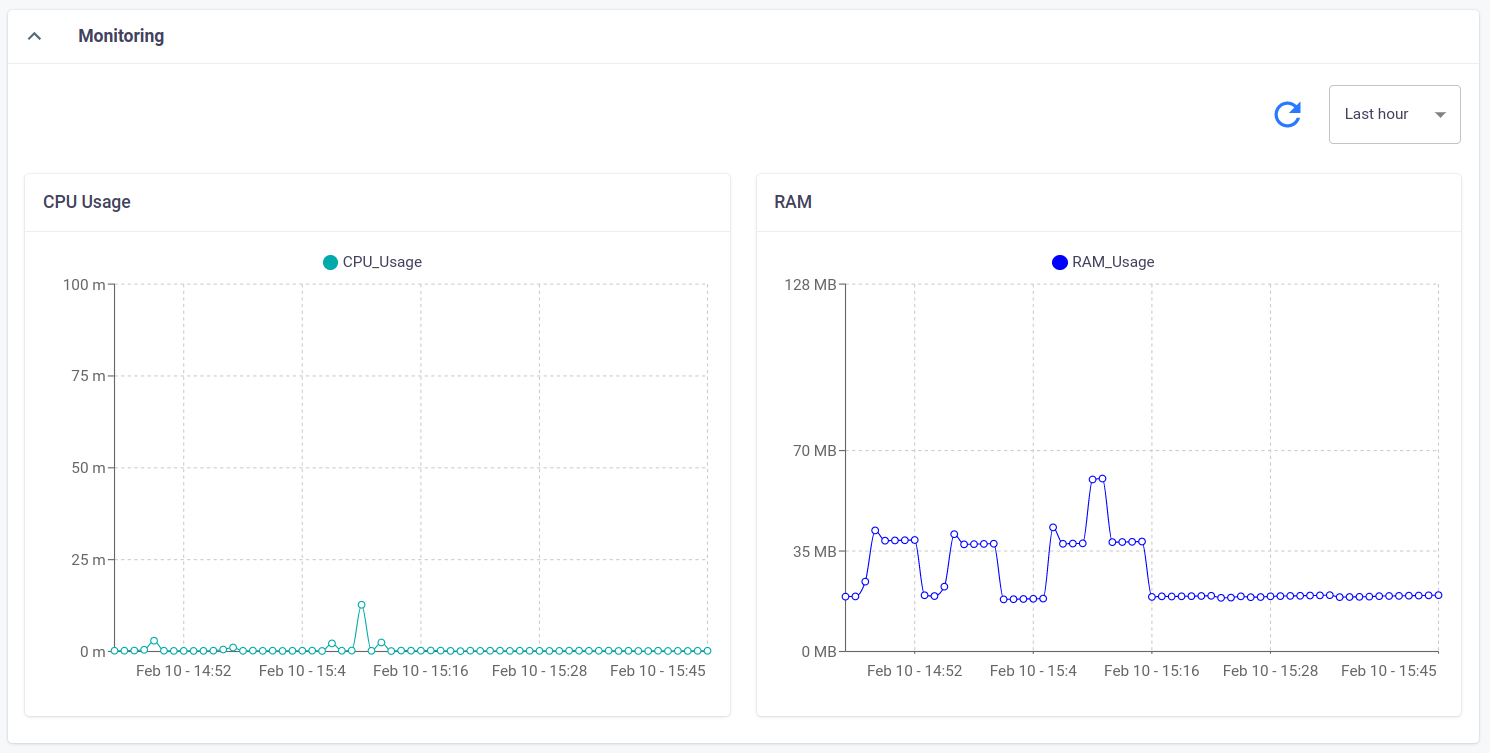
The Insights Tab allows you to monitor the CPU usage and RAM usage of a selected container in real-time.

Checking Container Health
Finally, you can also check the health of a selected container, including information on the Liveness and Readiness probes.

Conclusion
The Insights tab in 01Cloud’s environments provides a comprehensive view of running pods in a cluster, as well as detailed information on specific containers. You can monitor container performance in real-time, access the WebShell, view logs and container details, and check container health.
